Kubernetes Monitoring Guide Using Liveness Probe

Vivek is a Django developer. He spends his time studying new technologies and creating projects. He likes to explain complex concepts in his blogs.
Published on

Kubernetes is the leading cloud orchestration technology today, used by billion-dollar companies to small startups. The ability for Kubernetes to schedule, replicate, run, and revive the pods and containers is what makes it the most popular container orchestration tool out there.
In this tutorial, you will get to know about the special monitoring features of Kubernetes. By the end of this article, you will have a deep understanding of the idea behind Monitoring and implementing monitoring using Liveness Probe.
Prerequisites
- Kubernetes installed
- MiniKube installed, you can find installation instructions here
To avoid making this article unnecessarily long, we won’t go through the installation instructions for different operating systems.
Creating a Pod
Before getting into monitoring Pod, let’s launch a Pod that contains nginx server image in our Node. Create a file pod.yml and populate it with the following.
The above YAML file defines the Pod’s specification that will be used in our Node. The above pod is a simple nginx server.
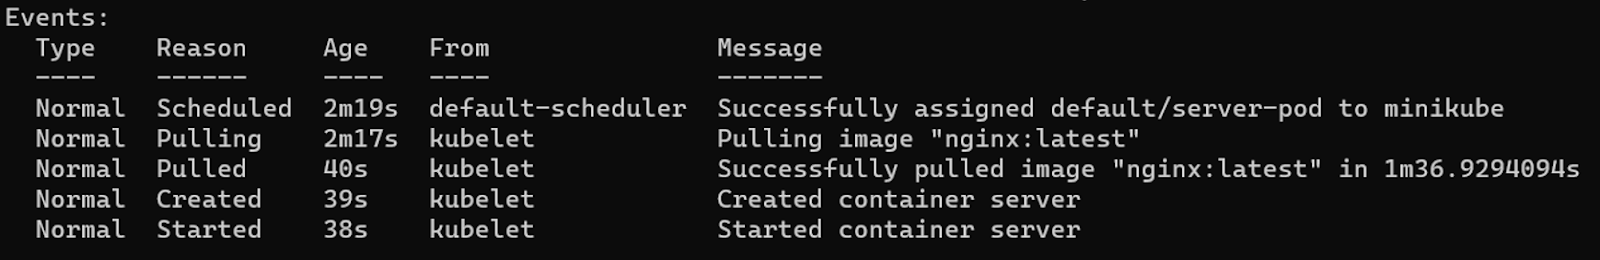
After saving the above file run kubectl create -f pod.yml, running this command will create a new Pod in your Node. You can check the status of your Node using kubectl get pods, this will generate the following output.

To see the events in the Pod in detail you can run kubectl describe -f pod.yml, running this command will generate a long output but the section we are concerned with can be found at the bottom of the output. This command will be useful when you want to inspect Pod events while Monitoring.
Now that your "server-pod" pod is up and running, what happens if something goes wrong with your nginx server and it crashes? Your application won't work, and you'll have to manually restart the pod. This is where monitoring may help; monitoring makes it possible to see and revive Pods when they crash in your Kubernetes Cluster.
You will learn more about this in the section below this.
Why is monitoring health necessary?
Although Kubernetes currently has a functionality that allows you to restart your container when the main process crashes, this proves useless if an issue arises inside the container itself. For example, if your application loops indefinitely or if your Nginx server has a memory leak.
Monitoring your pods is crucial to identify these issues and recover your pods. Monitoring makes sure that even if something goes wrong inside the container, your application will continue to operate. For monitoring purposes, Kubernetes has Liveness Probe and Readiness Probe; in this article, you will learn about Liveness Probe, and how to work with them.
What is a Liveness Probe?
A Kubernetes Monitoring Service called Liveness Probe is used to ping your pods at predetermined intervals to verify that your application is still operational. To verify whether your Pod is running or not, use the Liveness Probe. Liveness Probe is helpful when an application encounters a broken state from which it cannot recover without being restarted.
You can use Liveness Probe in your application by adding the livenessProbe configuration in the containers field in your YAML file, which you will see in the next section.
How to use liveness probe using YAML file in your Pod configuration
To use Liveness Probe in your container you have to edit your Pod YAML file and add the following configuration.
The above YAML file is similar to the previous pod.yml except it has a new containers.livenessProbe field. This configuration has the following parts.
- livenessProbe.httpGet: It is a method through which Kubernetes will check if the container is alive.
- initialDelaySeconds: It specifies how long after the container starts, the Probe should wait before checking.
- timeoutSeconds: It specifies the number of seconds under which the container has to respond otherwise it will be assumed to fail. In other words, it is the number of seconds your probe will wait for the container’s response.
- periodSeconds: It defines the number of seconds after which the Probe will again ping the container to see if it is still alive.
- failureThreshold: It signifies the number of times Kubernetes permits a container to fail before restarting it.
In a brief overview, you created a LivenessProbe that uses the httpGet method to check the container. When the container first starts, the Probe will wait five seconds before sending a GET request to localhost:port:path (localhost:8080/path/does/not/exists). If the request is denied, the Probe marks the container as failing and restarts it because the failureThreshold value was 1. The Probe would hold off on sending another GET request for 5 seconds (periodSeconds) if the container hadn’t failed.
To witness Liveness Probe in action you have to create the Pod defined in the above live-pod.yml file. Run the following command to create your Pod.
After running the above command you will see a confirmation output that the pod was created. To check the event in the pod run kubectl describe -f live-pod.yml and scroll down to the Events section, you will find the following output.
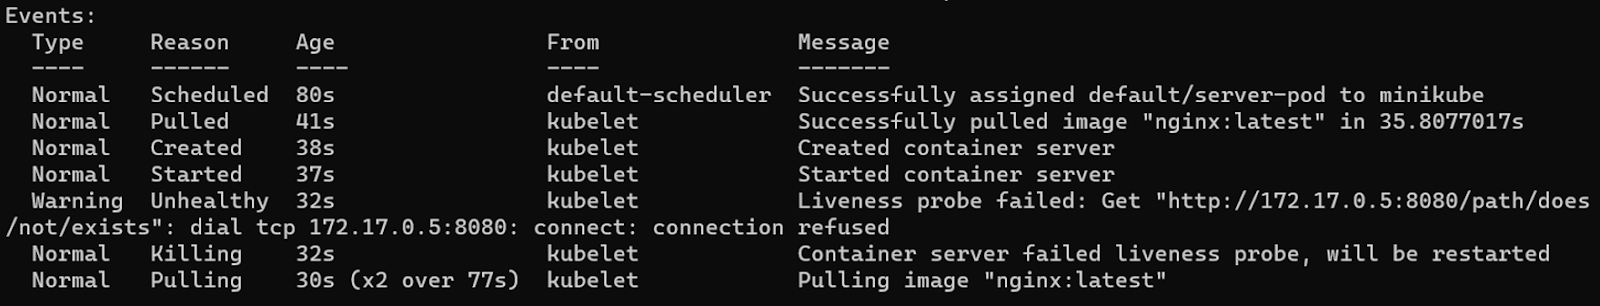
You can see in the above output that the Liveness probe tried to send the GET request, which failed so it started the container. Also, note that the kubelet creates the new container from scratch and does not restart the previous one.
Although you tested the containers using the httpGet field in the example above, Liveness Probe offers many additional possibilities, including tcpsocket, exec, and gRPC. Now that you are familiar with the fundamentals of probes, you can change your YAML file to utilize the type of probe that best fits your situation. Let's look at another example utilizing the Liveness probe's exec option. In this case, the container will be assured to not fail when pinged by the Probe, therefore we anticipate that Kubernetes won't need to restart it.
Create a new file live-pod-server.yml and populate it with the following configuration.
The above file is similar to what we created before except for the livenessProbe.exec, which defines a Probe that tests the container by running nginx -V command every three seconds. Now create this Pod using kubectl create -f live-pod-server.yml and get the events of the same Pod using kubectl describe live-pod.yml. This will generate the following output.
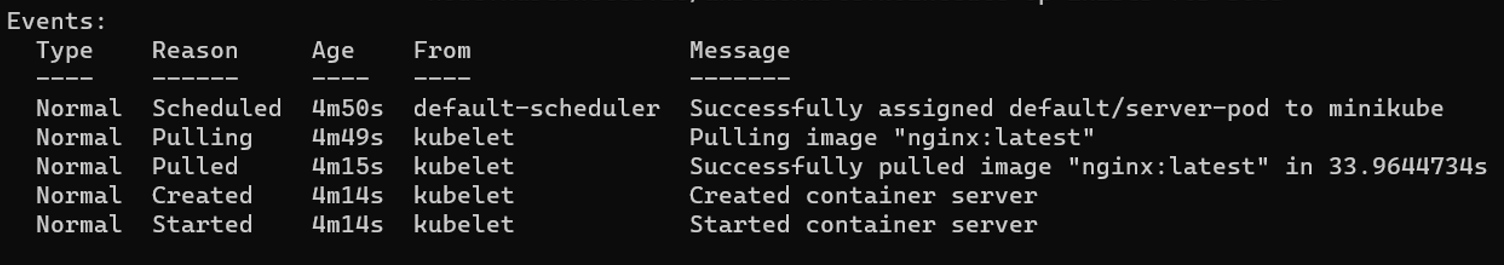
In this example, your container is not restarting because the livenessProbe.exec is passing every time.
Best Practices in using Liveness Probe
When monitoring container health in a production application, probes are crucial since without them Kubernetes is unable to determine whether a container is alive or not. When building Probe in a production app, there are a few things to keep in mind.
- A Probe should be small and light, which means it shouldn't consume a lot of memory. Since a Probe runs for a predetermined amount of time, this is important.
- periodSeconds, failureThreshold, and other parameters should be set after clearly analyzing the application. You don’t want a heavy probe to run every five seconds.
- Never use Probe for any other repetitive operations involving the container; only use it to determine whether the pod is alive.
- Probes should only be used after a complete inspection of the Pod, as not all Pods will require them.
Conclusion
Liveness Probes ensure that your application is always up and running by collaborating with the kubelet in Kubernetes to continuously perform repeating pings to the container. Liveness Probes are crucial to boosting your application's availability. When building Pod, a well-configured Liveness Probe can make a significant difference.
You learned the fundamentals of Kubernetes monitoring in this article, along with how Liveness Probe may be used to implement monitoring. Additionally, you created a pod that practically employs Liveness Probe and other settings in the Probe that you can utilize following the requirements of your application. In this article, you also went through the best practices that should be employed while creating the Pod.
There are still a lot more Liveness Probe options available that you might want to investigate. You can find the internal details of the Liveness Probe using this link.
Data-rich bug reports loved by everyone
Get visual proof, steps to reproduce and technical logs with one click


Put your knowledge to practice
Try Bird on your next bug - you’ll love it
“Game changer”
Julie, Head of QA


Overall rating: 4.7/5
Try Bird later, from your desktop